# How to draw vertical lines on a Datadog graph
Thu Mar 10 2022
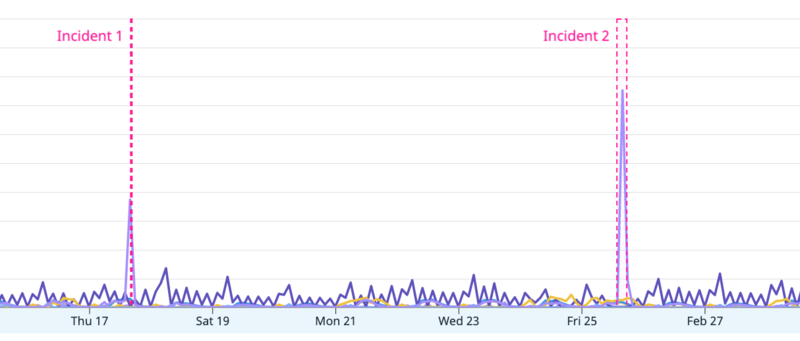
It's possible to draw vertical lines/range on a Datadog graph like this:
- Open the JSON (opens new window) tab of your graph:
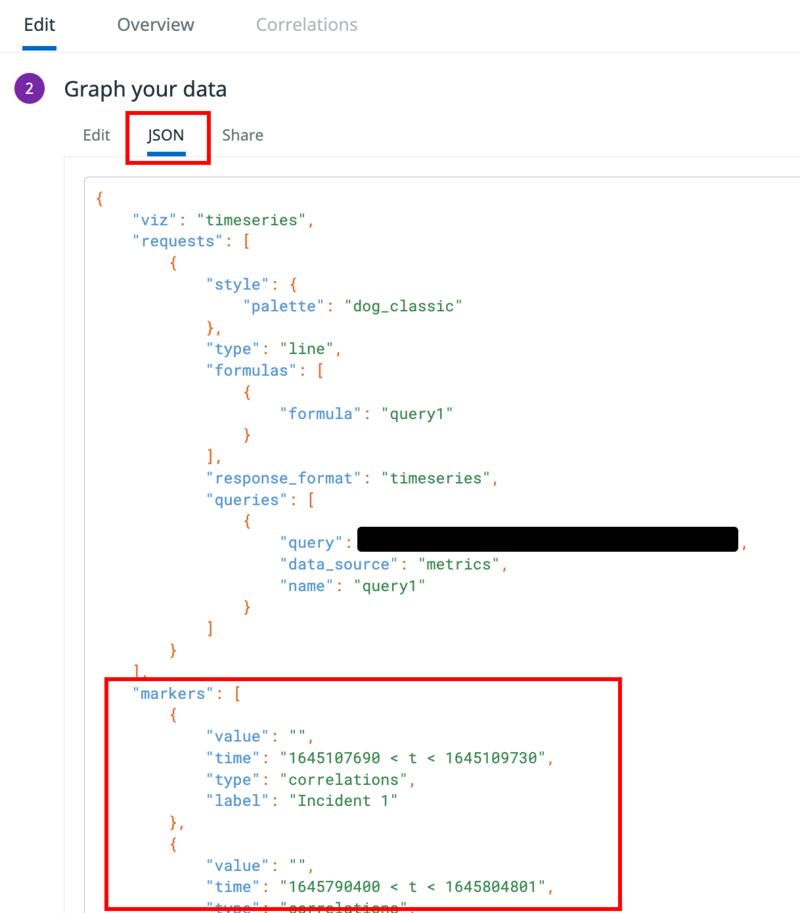
- Add or update the
"markers"field of your graph's JSON data and add new markers with the following format:
    "markers": [
        {
            "value": "",
            "time": "1645107690 < t < 1645109730",
            "type": "correlations",
            "label": "Incident 1"
        },
        {
            "value": "",
            "time": "1645790400 < t < 1645804801",
            "type": "correlations",
            "label": "Incident 2"
        }
    ]
1
2
3
4
5
6
7
8
9
10
11
12
13
14
2
3
4
5
6
7
8
9
10
11
12
13
14
- The time range needs to be in seconds since the Unix Epoch. You can use this handy website (opens new window) to convert between human-readable dates and seconds.
Newsletter
If you'd like to subscribe to my blog, please enter your details below. You can unsubscribe at any time.